Urban Heat Island Mapping and Tree Canopy Analysis

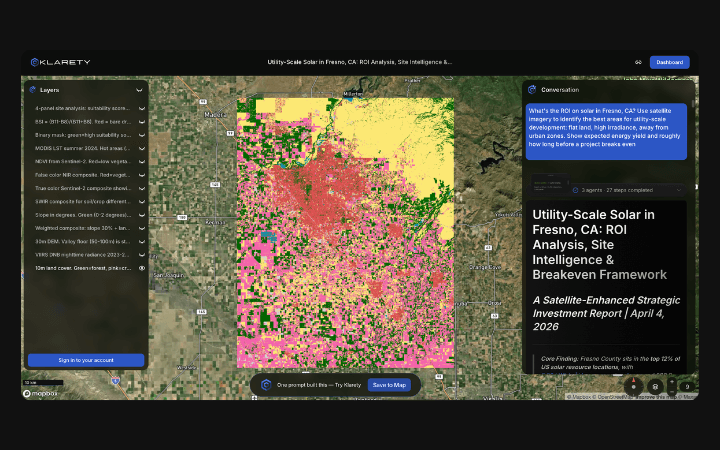
Identify which city districts run hottest and where green infrastructure will cool them most. Klarety processes Sentinel-2 thermal and vegetation indices to produce heat island severity maps correlated with tree canopy density and impervious surface cover. Planners target tree-planting and park investment at maximum thermal impact zones.

Heat island severity mapping for city planners

Klarety AI
Klarety AI chat composer interface

Thermal risk maps for any city from one prompt

Klarety agents process Sentinel-2 thermal and vegetation indices and return heat island severity maps with canopy correlation.

LST - Sentinel-2
Klarety satellite analysis output

Land surface temperature and canopy cooling scoring

Agents compute LST and tree canopy density to score which districts benefit most from targeted green infrastructure investment.

GIS Output
Klarety AI map annotation overlay

Thermal and canopy layers for urban GIS analysis

Export LST rasters and canopy density grids for urban heat mitigation model and city planning GIS tool integration.

LST and NDVI heat island severity scoring

Klarety agents derive land surface temperature from Landsat 8 Band 10 thermal infrared, compute NDVI canopy density from Sentinel-2, and map the negative correlation between canopy cover and LST at district level. Districts with high LST and low canopy are ranked for green infrastructure intervention priority. Output is a district-level heat vulnerability table and LST-canopy overlay raster.

Klarety AIMap heat islands in your city
analysis/urban_heat_island_mapping.pyAgent code
python
import eeimport numpy as np
ee.Initialize()
# Phoenix Arizona urban coreaoi = ee.Geometry.Rectangle([-112.15, 33.38, -111.85, 33.58])
# Landsat 8 Land Surface Temperaturels8 = (ee.ImageCollection('LANDSAT/LC08/C02/T1_L2')       .filterBounds(aoi)       .filterDate('2025-07-01', '2025-08-31')  # peak summer       .filter(ee.Filter.lt('CLOUD_COVER', 10))       .median())
# LST calculation from Band 10b10 = ls8.select('ST_B10').multiply(0.00341802).add(149.0)  # Kelvinlst_celsius = b10.subtract(273.15).rename('lst_c')
# Sentinel-2 NDVI (canopy density proxy)s2 = (ee.ImageCollection('COPERNICUS/S2_SR_HARMONIZED')      .filterBounds(aoi)      .filterDate('2025-07-01', '2025-08-31')      .filter(ee.Filter.lt('CLOUDY_PIXEL_PERCENTAGE', 10))      .median())ndvi = s2.normalizedDifference(['B8','B4']).rename('ndvi')
# NDBI: Normalized Difference Built-up Index (B11-B8)/(B11+B8)ndbi = s2.normalizedDifference(['B11','B8']).rename('ndbi')
# Heat vulnerability = high LST + low NDVI + high NDBIlst_norm  = lst_celsius.unitScale(30, 55)   # 30-55 °C rangendvi_norm = ndvi.unitScale(-0.1, 0.6)ndbi_norm = ndbi.unitScale(-0.3, 0.4)
heat_vuln = (lst_norm.multiply(0.5)             .add(ndbi_norm.multiply(0.3))             .subtract(ndvi_norm.multiply(0.2))             .rename('heat_vulnerability'))
# District statisticsstats = heat_vuln.reduceRegion(    ee.Reducer.mean().combine(ee.Reducer.percentile([75,90]), sharedInputs=True),    aoi, 30, maxPixels=1e9).getInfo()print(f"Mean heat vulnerability: {stats.get('heat_vulnerability_mean', 0):.3f}")print(f"75th percentile: {stats.get('heat_vulnerability_p75', 0):.3f}")print(f"90th percentile (hotspot threshold): {stats.get('heat_vulnerability_p90', 0):.3f}")
output/heat_island_report.mdOutput report
python
# Urban Heat Island Analysis Report**City:** Phoenix, Arizona (-112.15 to -111.85°W, 33.38 to 33.58°N)**Period:** Jul-Aug 2025 (peak summer) | **Source:** Landsat 8 LST + Sentinel-2
## Heat Vulnerability Summary- Mean LST: **44.2°C** (urban core) vs 38.1°C (suburban fringe)- Peak LST hotspot: **52.8°C** (downtown parking lots, industrial zones)- Mean canopy cover: **6.3%** — critically low (best practice: 20%+)- Heat vulnerability score: 0.71/1.0 (HIGH)
## District Heat Vulnerability Rankings| District         | Mean LST (°C) | Canopy (%) | Vuln Score | Priority   ||------------------|--------------|------------|------------|------------|| Downtown Core    | 48.4         | 3.1%       | 0.89       | Urgent     || Industrial SW    | 51.2         | 1.8%       | 0.94       | Urgent     || E Residential    | 44.8         | 7.4%       | 0.71       | High       || N Suburbs        | 41.3         | 12.1%      | 0.48       | Moderate   || Desert Preserve  | 38.6         | 18.4%      | 0.21       | Low        |
## Green Infrastructure ROI Estimate- 1% canopy increase in Downtown Core: est. -0.8°C LST reduction- 500 trees in Industrial SW: est. -0.4°C in 200m radius- Cooling value (energy savings + health): ~$1,200/tree/year (EPA estimate)
## MethodsLandsat 8 L2 Band 10 LST at 30m. Sentinel-2 NDVI + NDBI at 10m.Vulnerability = 0.5*LST + 0.3*NDBI - 0.2*NDVI (normalised 0-1).Confidence: High for LST. Medium for canopy-cooling projection.

Try Klarety now.