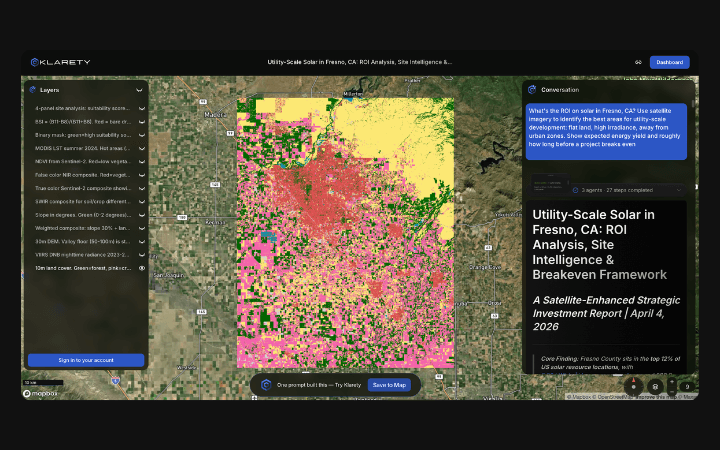
Urban Traffic Congestion Pattern Mapping from Satellites
Identify mobility bottlenecks and peak congestion zones without ground sensors. Klarety fuses optical time-series traffic indicators with road network data to map congestion intensity, temporal patterns, and origin-destination corridors. Planners receive weekly heatmaps to prioritize infrastructure investment decisions.
Analyze trafficCongestion mapping for urban infrastructure planners

Traffic pattern reports without ground sensor networks
Klarety agents fuse optical satellite data with road networks and return weekly congestion heatmaps by corridor.
Vehicle density and temporal congestion extraction
Agents compute vehicle density proxies from high-revisit optical passes and classify congestion intensity by time-of-day signature.
Congestion layers for urban mobility GIS tools
Export congestion heatmaps and origin-destination flow vectors for urban mobility model and GIS planning platform integration.
Optical vehicle density congestion heatmap generation
Klarety agents detect vehicle presence on road segments from Sentinel-2 and Planet imagery by identifying bright linear features consistent with vehicle density. Vehicle count per road segment is compared against off-peak baselines to classify congestion severity. Output is a weekly road-segment congestion GeoJSON and heatmap raster with peak congestion time classification.
Klarety AIMap traffic congestion in your city