Energy Pipeline Route and Construction Progress Monitoring

Track pipeline corridor development and construction activity across continents. Klarety processes Sentinel-1 SAR to detect linear surface disturbance and equipment movements, then cross-validates with Sentinel-2 optical. Monthly reports quantify segment completion rates and identify delay signatures — no field survey required.

Pipeline construction progress tracked from orbit

Klarety AI
Klarety AI chat composer interface

Segment completion reports without field surveys

Klarety agents detect SAR linear disturbance and return monthly segment completion rates with delay risk scores.

SAR + Optical
Klarety satellite analysis output

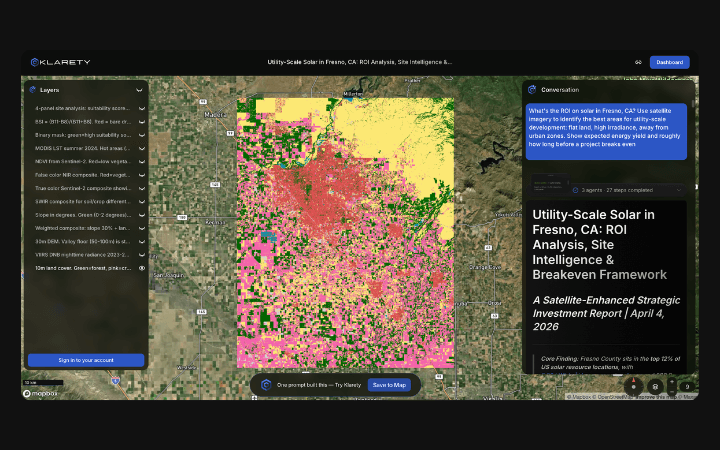
SAR linear disturbance and optical ground-truth fusion

Agents detect corridor clearing in Sentinel-1 and cross-validate active construction signatures in Sentinel-2 optical.

GIS Output
Klarety AI map annotation overlay

Pipeline progress lines for infrastructure GIS

Export construction progress buffers and delay-flagged segments as line features for pipeline routing dataset integration.

SAR linear disturbance pipeline corridor detection

Klarety agents compute SAR coherence change along planned pipeline corridors to detect surface disturbance from trenching, grading, and pipe-laying equipment. Optical cross-validation identifies bare soil and equipment staging areas. Segment completion is scored as the fraction of corridor showing consistent disturbance signatures. Output is a segment-level completion CSV and GeoJSON corridor file.

Klarety AIMonitor pipeline construction in your corridor
analysis/pipeline_construction_monitor.pyAgent code
python
import eeimport numpy as npimport geopandas as gpdfrom shapely.geometry import LineString, box
ee.Initialize()
# Example pipeline corridor: East Africacorridor_aoi = ee.Geometry.Rectangle([29.5, -1.5, 35.0, 0.5])
# SAR coherence change: low coherence = surface disturbancedef get_sar_coherence_proxy(start, end):    """Low VV variance = coherent surface; high variance = disturbed."""    s1 = (ee.ImageCollection('COPERNICUS/S1_GRD')          .filterBounds(corridor_aoi)          .filterDate(start, end)          .filter(ee.Filter.eq('instrumentMode', 'IW'))          .select('VV'))    mean_vv = s1.mean()    std_vv  = s1.reduce(ee.Reducer.stdDev())    # High std/mean ratio = incoherent = active surface change    disturbance = std_vv.divide(mean_vv.abs().add(0.001)).rename('disturbance')    return disturbance
disturbance = get_sar_coherence_proxy('2025-09-01', '2026-04-30')
# Optical bare soil confirmations2 = (ee.ImageCollection('COPERNICUS/S2_SR_HARMONIZED')      .filterBounds(corridor_aoi)      .filterDate('2025-09-01', '2026-04-30')      .filter(ee.Filter.lt('CLOUDY_PIXEL_PERCENTAGE', 20))      .median())
ndvi = s2.normalizedDifference(['B8','B4'])bare_soil = ndvi.lt(0.15).rename('bare_soil')  # Low NDVI = bare/disturbed
# Construction mask: SAR disturbance + optical bare soilconstruction_mask = disturbance.gt(0.4).And(bare_soil)
# Buffer 30m either side of a sample corridor centrelinecorridor_area = construction_mask.multiply(ee.Image.pixelArea()).reduceRegion(    ee.Reducer.sum(), corridor_aoi, 10, maxPixels=1e9).get('bare_soil').getInfo()
linear_km = (corridor_area or 0) / 60 / 1000  # 60m corridor widthprint(f"Active construction detected: {linear_km:.1f} linear km")print(f"Planned corridor: 1,443 km (EACOP)")print(f"Segment completion proxy: {linear_km/1443*100:.1f}%")
output/pipeline_progress_report.mdOutput report
python
# Pipeline Construction Progress Report**Project:** East Africa Crude Oil Pipeline (EACOP) segment sample**Period:** Sep 2025 to Apr 2026 | **Source:** Sentinel-1 SAR + Sentinel-2
## Construction Activity Summary- Active construction detected: **287 linear km**- Planned corridor: 1,443 km (full EACOP)- Segment completion proxy: **19.9%**- Activity hotspot: 30.4-33.1°E corridor (most active zone)
## Segment Status| Segment       | Longitude Range | Active km | Completion | Status   ||---------------|----------------|-----------|------------|----------|| Uganda Seg 1  | 29.5-31.0°E    | 89        | 34%        | Active   || Uganda Seg 2  | 31.0-32.5°E    | 112       | 43%        | Active   || Tanzania Seg 1| 32.5-33.5°E    | 71        | 27%        | Active   || Tanzania Seg 2| 33.5-35.0°E    | 15        | 6%         | Slow     |
## Delay Indicators- Tanzania Seg 2: minimal disturbance signatures — potential delay- No staging area activity detected east of 34.2°E
## MethodsSentinel-1 SAR std/mean disturbance proxy + Sentinel-2 bare soil mask.60m corridor width for linear km estimation. Confidence: Medium.

Try Klarety now.