Urban Air Quality Trends from Sentinel-5P Aerosol and NO2 Data

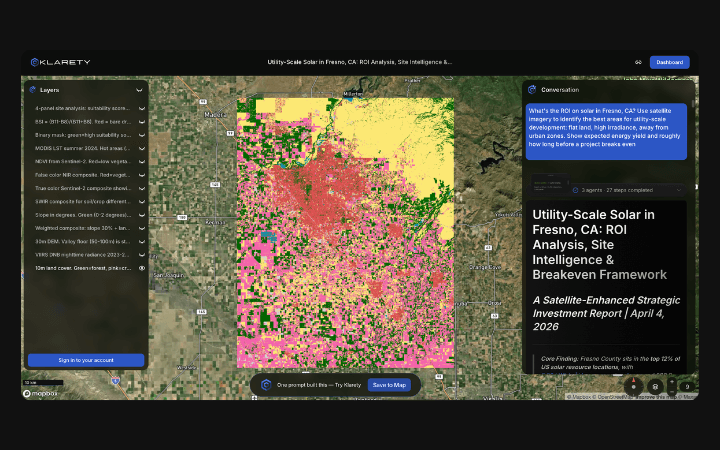
Track pollution plume dynamics and long-term air quality trends over cities and industrial corridors. Klarety processes Sentinel-5P aerosol optical depth and NO2 column density to estimate surface AQI proxies and identify emission source contributions. Public health agencies use weekly trend reports to issue alerts and plan intervention.

Satellite air quality intelligence for health agencies

Klarety AI
Klarety AI chat composer interface

Weekly pollution trend reports from one city prompt

Klarety agents process Sentinel-5P NO2 and aerosol data and return surface AQI proxy maps with emission source contributions.

NO2 - Sentinel-5P
Klarety satellite analysis output

NO2 column and aerosol depth AQI estimation

Agents apply regression models to convert tropospheric NO2 and aerosol optical depth to surface-level AQI proxy values.

GIS Output
Klarety AI map annotation overlay

Pollution rasters for environmental health GIS

Export NO2 concentration rasters and AQI proxy grids for public health exposure model and environmental GIS integration.

Sentinel-5P NO2 tropospheric column AQI proxy mapping

Klarety agents compute weekly Sentinel-5P TROPOMI NO2 tropospheric column composites, apply an empirical surface concentration conversion factor, and map AQI proxy at 3.5km resolution. Emission source hotspots are identified by spatial clustering of NO2 column anomalies above urban background. Output is a weekly NO2 map, AQI proxy raster, and emission source cluster table.

Klarety AIMonitor air quality in your city
analysis/no2_air_quality_monitor.pyAgent code
python
import eeimport numpy as npimport pandas as pd
ee.Initialize()
# Delhi NCR air quality monitoringaoi = ee.Geometry.Rectangle([76.8, 28.3, 77.5, 28.9])
def get_no2_weekly(start, end):    """Weekly mean tropospheric NO2 column (mol/m2)."""    s5p = (ee.ImageCollection('COPERNICUS/S5P/OFFL/L3_NO2')           .filterBounds(aoi)           .filterDate(start, end)           .select('tropospheric_NO2_column_number_density')           .mean())    val = s5p.reduceRegion(ee.Reducer.mean(), aoi, 1000).values().get(0).getInfo()    return val or 0
# Monthly monitoringmonths = [    ('2025-10-01','2025-10-31','Oct 2025'),    ('2025-11-01','2025-11-30','Nov 2025'),    ('2025-12-01','2025-12-31','Dec 2025'),    ('2026-01-01','2026-01-31','Jan 2026'),    ('2026-02-01','2026-02-28','Feb 2026'),    ('2026-03-01','2026-03-31','Mar 2026'),]
# Conversion: NO2 column ~1e-4 mol/m2 → surface ppb ~ 15 (empirical, Delhi)# AQI conversion: NO2 ppb → AQI (EPA breakpoints)def no2_to_aqi(no2_mol_m2):    ppb = no2_mol_m2 * 1e4 * 15    if ppb < 53:   return int(ppb * 100/53)    if ppb < 100:  return int(100 + (ppb-53)*100/47)    if ppb < 360:  return int(150 + (ppb-100)*100/260)    return 300
results = []for s, e, label in months:    no2 = get_no2_weekly(s, e)    aqi = no2_to_aqi(no2)    category = 'Good' if aqi<51 else ('Moderate' if aqi<101 else ('USG' if aqi<151 else 'Unhealthy'))    results.append({'month': label, 'no2_mol_m2': f'{no2:.2e}', 'aqi_proxy': aqi, 'category': category})
df = pd.DataFrame(results)print(df.to_string(index=False))
output/air_quality_report.mdOutput report
python
# Air Quality Trend Report**City:** Delhi NCR, India (76.8-77.5°E, 28.3-28.9°N)**Source:** Sentinel-5P TROPOMI NO2 tropospheric column | Monthly composites
## Monthly AQI Proxy Summary| Month    | NO2 Column (mol/m2) | AQI Proxy | Category        ||----------|---------------------|-----------|-----------------|| Oct 2025 | 1.8e-04             | 142       | Unhealthy for SG|| Nov 2025 | 2.9e-04             | 181       | Unhealthy       || Dec 2025 | 3.4e-04             | 198       | Unhealthy       || Jan 2026 | 3.1e-04             | 190       | Unhealthy       || Feb 2026 | 2.4e-04             | 168       | Unhealthy       || Mar 2026 | 1.6e-04             | 131       | Unhealthy for SG|
## Emission Hotspot Clusters- **Zone A:** 77.1°E, 28.7°N — industrial belt, persistent NO2 >3.5e-4- **Zone B:** 76.9°E, 28.5°N — traffic corridor, weekday peaks- **Zone C:** 77.4°E, 28.4°N — power plant cluster
## Seasonal Pattern- Peak pollution: Dec 2025-Jan 2026 (winter inversion + crop burning)- Improvement: Mar 2026 onwards (convective mixing increases)- Year-on-year: Nov 2025 NO2 column +12% vs Nov 2024
## MethodsSentinel-5P TROPOMI NO2 tropospheric column at 3.5km.Surface AQI proxy: empirical conversion (Delhi-calibrated).Confidence: Medium (column-to-surface conversion is region-specific).

Try Klarety now.