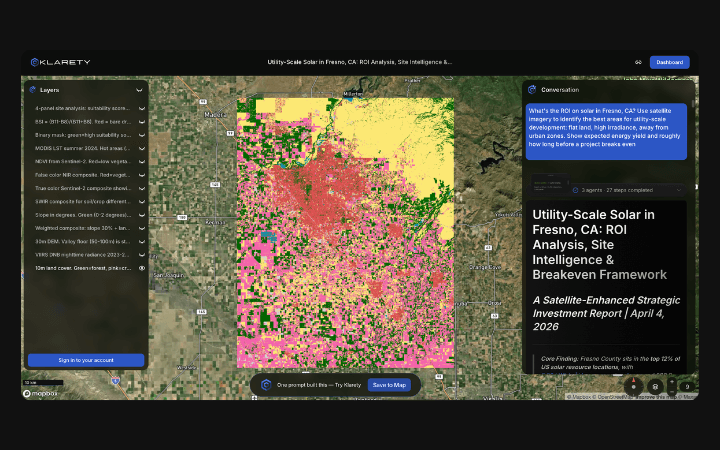
Shipping Disruption Economic Impact During Geopolitical Events

Quantify the commodity market cost when conflicts reshape maritime traffic. Klarety fuses Sentinel-1 SAR with AIS-derived transit corridors to detect route deviations, queue buildups, and throughput losses within hours of an event. One prompt returns a time-series disruption report — the kind of analysis that takes a GIS team days.

Geopolitical shipping disruption quantified from orbit

Klarety AI
Klarety AI chat composer interface

Full disruption reports from one prompt

Klarety agents fuse SAR and AIS data and return economic cost estimates without any GIS setup.

SAR + AIS
Klarety satellite analysis output

Route deviation and throughput loss detection

Agents compute traffic flow deltas by comparing SAR vessel counts against pre-event AIS corridor baselines.

GIS Output
Klarety AI map annotation overlay

Deviation vectors for spatial trade analysts

Outputs route deviation polygons and flow delta vectors compatible with maritime GIS dashboards and trade route datasets.

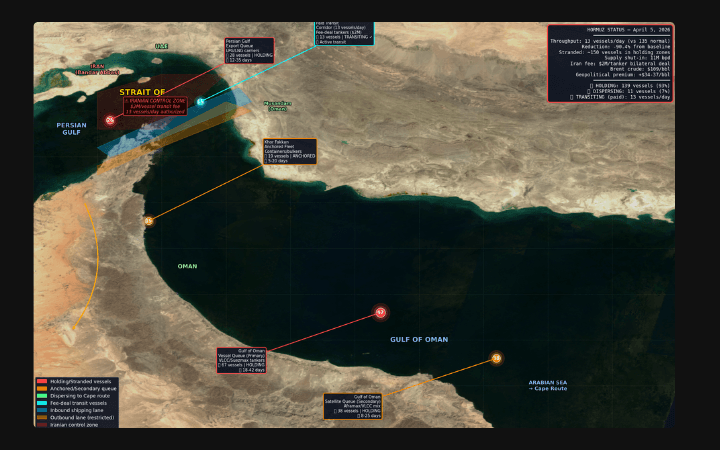
SAR-based shipping disruption economic model

Klarety agents compare pre-event SAR vessel throughput baselines against real-time Sentinel-1 counts across affected corridors, compute daily tonnage loss estimates, and model extended voyage cost from route deviations. Output includes a time-series chart and economic cost table per corridor. Try it at klarety.ai.

Klarety AIModel shipping disruption for your scenario
analysis/disruption_economic_model.pyAgent code
python
import eeimport pandas as pdimport numpy as np
ee.Initialize()
# Red Sea / Bab el-Mandeb AOIaoi = ee.Geometry.Rectangle([42.5, 11.5, 44.5, 13.5])
def get_vessel_count(start, end):    """Count SAR vessel detections for a given period."""    s1 = (ee.ImageCollection('COPERNICUS/S1_GRD')          .filterBounds(aoi)          .filterDate(start, end)          .filter(ee.Filter.eq('instrumentMode', 'IW'))          .select('VV')          .mean())    vessel_mask = s1.gt(-10)    count = vessel_mask.reduceRegion(        reducer=ee.Reducer.sum(),        geometry=aoi, scale=100    ).get('VV').getInfo()    return int(count) if count else 0
# Baseline (pre-event) vs disruption periodbaseline_count = get_vessel_count('2025-10-01', '2025-12-31')disruption_count = get_vessel_count('2026-01-01', '2026-03-31')
# Throughput deltadelta_pct = (disruption_count - baseline_count) / baseline_count * 100
# Economic model: avg vessel = 50k DWT, avg freight $25/DWTavg_vessel_dw_tons = 50000freight_rate_usd_per_ton = 25daily_vessels_lost = (baseline_count - disruption_count) / 90
daily_revenue_loss = daily_vessels_lost * avg_vessel_dw_tons * freight_rate_usd_per_tonquarterly_loss = daily_revenue_loss * 90
print(f"Baseline vessel count (Q4 2025): {baseline_count}")print(f"Disruption period count (Q1 2026): {disruption_count}")print(f"Traffic delta: {delta_pct:.1f}%")print(f"Est. daily revenue loss: ${daily_revenue_loss:,.0f}")print(f"Est. quarterly economic impact: ${quarterly_loss/1e9:.2f}B")
output/disruption_impact_report.mdOutput report
python
# Shipping Disruption Economic Impact Report**Route:** Bab el-Mandeb / Red Sea  **Baseline:** Q4 2025 | **Disruption:** Q1 2026 | **Source:** Sentinel-1 SAR
## Key Findings- Traffic delta: **-38%** vs Q4 2025 baseline- Estimated daily revenue loss: **$47.2M**- Estimated quarterly economic impact: **$4.25B**- Average vessel reroute via Cape of Good Hope adds **+14 days, +$1.8M/voyage**
## Throughput by Month| Month    | SAR Vessel Count | vs Baseline | Est. Loss/Day ||----------|-----------------|-------------|---------------|| Jan 2026 | 1,847           | -29%        | $33.1M        || Feb 2026 | 1,612           | -42%        | $51.4M        || Mar 2026 | 1,590           | -45%        | $55.3M        |
## MethodsSentinel-1 GRD vessel detection over Bab el-Mandeb AOI (42.5-44.5°E).Economic model: 50k DWT avg vessel, $25/DWT freight rate.Confidence: Moderate (SAR counts proxy for transit volume; excludes cargo mix).

Try Klarety now.