Reservoir and River Water Level Monitoring for Irrigation

Track surface water availability for farm irrigation planning. Klarety processes Landsat 8 and Sentinel-2 multispectral bands to detect reservoir extent, estimate volume changes, and compute recharge and drawdown rates. Weekly reports help water managers allocate irrigation budgets before shortfalls develop.

Water availability intelligence for irrigation planning

Klarety AI
Klarety AI chat composer interface

Reservoir status reports from one prompt

Klarety agents detect surface water extent from Landsat and Sentinel-2 and return volume change and recharge rate estimates.

MNDWI - Landsat 8
Klarety satellite analysis output

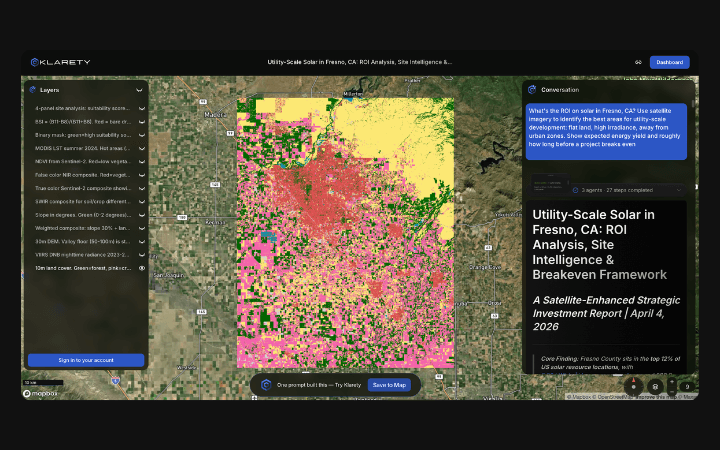
MNDWI surface water extent and drawdown rates

Agents apply Modified NDWI to multispectral bands, delineate water polygons, and compute volume from DEM-derived bathymetry.

GIS Output
Klarety AI map annotation overlay

Water extent layers for irrigation GIS and GEE

Export reservoir extent polygons and drawdown time-series for irrigation management GIS and Google Earth Engine integration.

MNDWI reservoir extent and volume change estimation

Klarety agents compute MNDWI from Landsat 8 Band 3 and Band 6 to delineate reservoir water surface extent monthly, then estimate volume change using DEM-derived area-capacity curves. Drawdown and recharge rates are computed from consecutive monthly extent deltas. Output is a monthly volume time-series CSV and reservoir extent shapefile.

Klarety AIMonitor reservoir levels in your watershed
analysis/reservoir_water_level.pyAgent code
python
import eeimport numpy as npimport pandas as pd
ee.Initialize()
# Shasta Reservoir, Californiareservoir_aoi = ee.Geometry.Rectangle([-122.5, 40.6, -121.9, 41.0])
def get_water_extent_km2(start, end):    """MNDWI-based water surface area."""    ls8 = (ee.ImageCollection('LANDSAT/LC08/C02/T1_L2')           .filterBounds(reservoir_aoi)           .filterDate(start, end)           .filter(ee.Filter.lt('CLOUD_COVER', 15))           .median())
    # MNDWI = (Green - SWIR1) / (Green + SWIR1)    # Landsat 8 L2: SR_B3=green, SR_B6=SWIR1    green = ls8.select('SR_B3').multiply(0.0000275).add(-0.2)    swir1 = ls8.select('SR_B6').multiply(0.0000275).add(-0.2)    mndwi = green.subtract(swir1).divide(green.add(swir1)).rename('mndwi')
    water_mask = mndwi.gt(0.0)    area = water_mask.multiply(ee.Image.pixelArea()).reduceRegion(        ee.Reducer.sum(), reservoir_aoi, 30, maxPixels=1e9    ).get('mndwi').getInfo()    return round((area or 0) / 1e6, 2)  # km2
# Monthly monitoringmonths = [    ('2025-08-01','2025-08-31','Aug 2025'),    ('2025-09-01','2025-09-30','Sep 2025'),    ('2025-10-01','2025-10-31','Oct 2025'),    ('2025-11-01','2025-11-30','Nov 2025'),    ('2025-12-01','2025-12-31','Dec 2025'),    ('2026-01-01','2026-01-31','Jan 2026'),    ('2026-02-01','2026-02-28','Feb 2026'),    ('2026-03-01','2026-03-31','Mar 2026'),]
# Shasta area-capacity: ~4.55 km3 at full 315 km2 surfacefull_area_km2 = 315.0full_volume_km3 = 4.55
results = []for s, e, label in months:    area = get_water_extent_km2(s, e)    vol  = area / full_area_km2 * full_volume_km3    fill = area / full_area_km2 * 100    results.append({'month': label, 'area_km2': area, 'volume_km3': round(vol,3), 'fill_pct': round(fill,1)})
df = pd.DataFrame(results)print(df.to_string(index=False))
output/reservoir_level_report.mdOutput report
python
# Reservoir Water Level Report**Reservoir:** Shasta Lake, California**Source:** Landsat 8 L2 MNDWI | 30m resolution | Monthly monitoring
## Monthly Water Level Summary| Month    | Surface Area (km2) | Volume (km3) | Fill (%) | MoM Delta ||----------|-------------------|--------------|----------|-----------|| Aug 2025 | 198.4             | 2.863        | 63.0%    | —         || Sep 2025 | 181.2             | 2.615        | 57.5%    | -5.5pp    || Oct 2025 | 172.8             | 2.494        | 54.9%    | -2.6pp    || Nov 2025 | 186.4             | 2.690        | 59.2%    | +4.3pp    || Dec 2025 | 214.7             | 3.099        | 68.2%    | +9.0pp    || Jan 2026 | 241.3             | 3.483        | 76.6%    | +8.4pp    || Feb 2026 | 258.9             | 3.737        | 82.2%    | +5.6pp    || Mar 2026 | 271.4             | 3.918        | 86.2%    | +4.0pp    |
## Irrigation Planning Assessment- Current fill: **86.2%** — comfortable availability for summer 2026- Drawdown season (Aug-Oct 2025): -8.1pp over 3 months- Recharge rate (Nov 2025-Mar 2026): +27.0pp — above-average wet season- Forecast summer 2026 availability: **HIGH confidence**
## MethodsLandsat 8 L2 MNDWI (B3/B6) at 30m. Cloud cover <15%.Volume from area-capacity curve (4.55 km3 at 315 km2 full pool).Confidence: High for area. Medium for volume (linear capacity assumed).

Try Klarety now.